Greenhouse gas emissions and climate protection
Relevance of the topic
Curbing and adapting to climate change are among the greatest challenges the world currently faces. LUKB is aware that combating climate change demands a concerted effort from all actors.
The business activities of a bank also cause greenhouse gas emissions. On the one hand, such emissions are generated directly during its own business operations, such as heating its premises, making trips in company vehicles or purchasing electricity and heat from district heating plants.
On the other hand, most emissions are generated indirectly through financing for private individuals, companies and other organisations as well as through the investment of customer funds and own bank assets. For example, the buildings and companies that LUKB finances cause emissions. However, companies and countries that LUKB or its clients invest in also contribute to emissions. In the financial sector, these indirect emissions are referred to as ‘financed emissions’ in accordance with the international standards of the Partnership for Carbon Accounting Financials (PCAF)1).
Climate change entails both risks and opportunities for banks. Risks include physical damage from floods, storms, heat waves, etc. as well as transition risks, which can arise, for example, from new legal or regulatory requirements. Climate change also contributes to the loss of biodiversity, another potentially significant risk factor for the global economy.
As in the previous year, reporting on LUKB's climate-related risks and opportunities in this Sustainability Report is based on the recommendations of the Task Force on Climate-related Financial Disclosures (TCFD)2). The requirements of the Ordinance on Climate Disclosures are thus implemented.
This report on greenhouse gas emissions and climate protection also forms the basis for climate reporting to the Canton of Lucerne (the majority shareholder of LUKB) in line with its 2025 Ownership Strategy3).
2) https://www.fsb-tcfd.org
3) https://www.lukb.ch/statuten (in German)
Principle
LUKB contributes to climate protection by pursuing net-zero targets. Priority is given to reducing greenhouse gas emissions in its own operations and along the value chain. In the second place, unavoidable emissions are to be offset on the market through compensation measures (climate protection projects to remove CO2 from the atmosphere, also known as negative emission approaches).
LUKB periodically assesses all risk categories throughout the Group. This also includes climate-related financial risks, which are treated as drivers for the risk categories of default, market, liquidity, operational, compliance, strategic and reputational risks and therefore form part of LUKB's systematic risk management.
Targets
Net-zero target by 2050
LUKB remains committed to the net-zero target for 2050 in line with:
- The climate strategy of the Swiss federal government and the Canton of Lucerne to implement the Paris Agreement, which Switzerland ratified in October 2017
- The Climate and Innovation Act (CIA), which Swiss voters adopted on 18 June 2023
- The requirements of the 2025 LUKB Ownership Strategy of the Canton of Lucerne, which were derived from the cantonal government's own climate strategy1)
Progress towards reaching these targets depends on various factors, which are partly outside the sphere of influence of LUKB. A key prerequisite here is the decarbonisation of the economy over the coming years. LUKB relies on the necessary political frameworks being put in place and on significant progress being made in the near future with processes and technologies that prevent and remove emissions. The uncertainties include macroeconomic developments, such as the effect of the economy and interest rates on the financial situation and thus on the affordability of decarbonisation measures by property owners and companies.
Scope 1 and Scope 2 of the net-zero target in 2030
In addition, LUKB aims to reach the net-zero target as early as 2030 with regard to its direct greenhouse gas emissions (Scope 1) and its indirect energy-related greenhouse gas emissions (Scope 2). The main means of achieving this will be a range of measures to further reduce Scope 1 and Scope 2 emissions. Secondly, residual greenhouse gas emissions should be offset.
Further interim targets are described in ‘Climate strategy/climate transition plan‘ in this section.
Status in 2025
Greenhouse gas balance sheet
LUKB prepares an annual balance sheet of its greenhouse gas emissions (‘GHG emissions‘). It shows the effectiveness of the measures taken and includes the following emissions:
- Scope 1 emissions: direct greenhouse gas emissions
- Scope 2 emissions: indirect energy-related greenhouse gas emissions
- Scope 3 emissions: other indirect greenhouse gas emissions that occur upstream or downstream along LUKB's value chain that include operational greenhouse gas emissions (e.g. due to employee business trips and commutes) as well as financed emissions caused elsewhere by LUKB's financing and investment activities
With the exception of financed emissions, the GHG balance sheet is prepared according to the industry standard ‘VfU key figures’ of the Verein für Umweltmanagement und Nachhaltigkeit in Finanzinstituten e.V.1), which uses the international standards of the Greenhouse Gas Protocol (GHG Protocol)2).
Financed emissions are calculated and disclosed in accordance with the approaches of the industry standard of the Partnership for Carbon Accounting Financials (PCAF)3) relevant to LUKB. LUKB joined the PCAF initiative in 2023 and is working with the PCAF and other PCAF member banks to improve its data quality, calculation methods and disclosure.
In accordance with the requirements of the GHG Protocol, LUKB has defined criteria to ensure the consistency and comparability of its GHG footprints over time. Historical emissions are recalculated if structural changes or methodological adjustments are made or if significant errors become known. Materiality principles are used to determine whether an adjustment to the base year or other historical emission values is needed.
GHG emissions are reported in terms of CO2 equivalents (CO2e), a unit of measurement for greenhouse gas comparability. The unit of measurement combines the different greenhouse gases in a common unit based on their Global Warming Potential (GWP) compared to carbon dioxide (CO2). According to the GHG Protocol, 1 tCO2e is the amount of a greenhouse gas that has the same warming effect as 1 tonne of CO2 over a century.
The carbon footprint covers all locations within the Group.
2) https://ghgprotocol.org
3) https://carbonaccountingfinancials.com
Scope 1 and Scope 2 GHG emissions
LUKB's Scope 1 emissions are mainly caused by the oil and gas for heating its premises as well as by the fossil fuels for its vehicles and coolants.
The Scope 2 emissions mainly relate to the purchase of district heating, which means LUKB calculates the GHG emissions generated by external energy producers and suppliers pro rata as Scope 2 emissions in accordance with the GHG Protocol. All the electricity that LUKB purchases comes from renewable energy sources.
Numerous factors affect the level of greenhouse gas emissions. Significant examples here are the number of heating degree days, increase in employee numbers and changes in the use of building space and the interior design (e.g. a result of advances in digitalisation).
LUKB is well on the way to reaching its 2030 net-zero target for Scope 1 and Scope 2 greenhouse gas emissions.
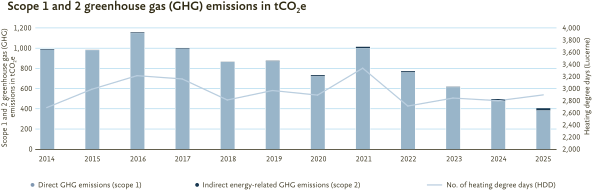
Scope 1 emissions 385 tonnes of CO2 equivalents (tCO2e) in total in 2025, compared with 476 tCO2e in the previous year. This corresponds to a 19 % reduction compared to the previous year and a 61 % reduction compared to 2014. The further year-on-year decline is mainly due to progress in the fossil-free heat supply of business premises. LUKB's head office in Lucerne currently still has gas heating and thus causes the most Scope 1 emissions. The switch to district heating has been planned for some time now. Project implementation has been delayed by the energy supplier and is now scheduled for the 2026/27 heating period.
Scope 2 emissions remained roughly constant year-on-year at 22 tCO2e. The increase from 7 tCO2e in 2014 to 22 tCO2e in 2025 is mainly due to the switch from fossil heating to district heating at various locations, which significantly reduced Scope 1emissions (see above), but increased Scope 2 emissions to a much lesser extent.
LUKB has cut its Scope 1 and Scope 2 greenhouse gas emissions by 59 % overall since 2014. It has done so mainly by switching to fossil-free heating, installing solar panels and implementing a range of energy-saving measures. This reduction was possible without purchasing climate offsets (‘CO2 certificates’).
Except in the case of flights and print orders, LUKB does not currently use any comprehensive offsetting solutions. However, it actively monitors the market for negative emission approaches and has regular contact with various providers of corresponding solutions.
The following table shows the trend in Scope 1 and Scope 2 greenhouse gas emissions since 2014:
Scope 1 and 2 GHG emissions1) | Unit | 2014 | … | 2024 | 2025 | Change from 2014 to 2025 | ||||||
Scope 1 | tCO2e | 984 | 476 | 385 | – 61 % | |||||||
Heating | tCO2e | 951 | 432 | 339 | ||||||||
Emergency power generators | tCO2e | 1 | 1 | 1 | ||||||||
Own vehicles | tCO2e | 30 | 29 | 28 | ||||||||
Refrigerants | tCO2e | 1 | 14 | 17 | ||||||||
Scope 2 – market-based | tCO2e | 7 | 22 | 22 | 218 % | |||||||
Electricity | tCO2e | 0 | 0 | 0 | ||||||||
District heating/cooling | tCO2e | 7 | 22 | 22 | ||||||||
Total Scope 1 and 2 | tCO2e | 991 | 498 | 406 | – 59 % | |||||||
Number of staff, annual average | FTEs | 946.4 | 1,160.0 | 1,191.7 | 26 % | |||||||
Intensity of Scope 1 and 2 GHG emissions | kgCO2e/FTE | 1,046.6 | 429.3 | 340.9 | – 67 % | |||||||
No. of heating degree days (HDDs) | HDDs | 2,682 | 2,797 | 2,893 | ||||||||
Scope 1 and 2 GHG emissions per heating degree day (HDD) | tCO2e/HDD | 0.369 | 0.178 | 0.140 | – 62 % | |||||||
Scope 2 – location-based | tCO2e | 544 | 430 | 424 | – 22 % | |||||||
Electricity2) | tCO2e | 537 | 408 | 402 | ||||||||
District heating/cooling | tCO2e | 7 | 22 | 22 |
1)Base year: 2014
The reported greenhouse gas emissions are gross volumes in tonnes of CO2 equivalents (tCO2e). Gross means before deducting any climate offsets. There were no climate offsets for Scope 1 and 2 greenhouse gas emissions in the period shown.
Source of emission factors: ‘Ecoinvent’ database V 3.7.1 from October 2020 for 2014 to 2023, ‘Ecoinvent’ V 3.10 from October 2023 for 2024 onwards. The ‘Ecoinvent’ database has data on the following greenhouse gases: carbon dioxide (CO2), methane (CH4), nitrous oxide (N2O), hydrofluorocarbons (HFCs), perfluorocarbons (PFCs), sulphur hexafluoride (SF6) and nitrogen trifluoride (NF3).
Biogenic CO2 emissions, i.e. direct CO2 emissions from the combustion or biodegradation of biomass, are not material at LUKB.
Accounting is based on the Greenhouse Gas Protocol (GHG Protocol). Consolidation method: full consolidation of subsidiaries wholly owned by the parent company (see information on the scope of consolidation in the section «About this sustainability report»). Otherwise, there are no other investments to be consolidated.
The figures cover all locations within the Group.
For Scope 2 emissions, and unless stated otherwise, accounting follows the market-based approach. ‘GHG Protocol Scope 2 Guidance’ requires an organisation to report two different Scope 2 values: a location-based value and a market-based value. Location-based value: emissions based on the emission intensity of the local grid area where the electricity is consumed; market-based value: emissions based on the electricity LUKB has purchased under its contracts with its electricity suppliers (effective supplier mix).
Tools used: ‘VfU-Kennzahlen 2022’ calculation tool (version 1.1, update of 12.07.2022) for 2014 to 2023, ‘VfU-Kennzahlen 2024’ calculation tool from 2024 onwards (version 1.4 from 25.11.2024).
Other sources for calculation and disclosure: ‘VfU-Kennzahlen’ industry metric from the Verein für Umweltmanagement und Nachhaltigkeit in Finanzinstituten e.V. and the standards of the Global Reporting Initiative (GRI).
2)Correction of location-based emissions due to electricity consumption in 2024 based on effective billing for a property from 393 tCO2e to 408 tCO2e
Trend in Scope 1 and Scope 2 greenhouse gas emissions since 2014:
Scope 3 greenhouse gas emissions
Scope 3 emissions include other indirect greenhouse gas emissions that occur upstream or downstream in LUKB's value chain. They are mainly financed emissions (Category 15 of the Greenhouse Gas Protocol). Measured in terms of their volume, other Scope 3 emissions are much less significant than financed emissions.
The table below lists the other Scope 3 GHG emissions for 2023 (base year), 2024 and 2025. The ‘Financed emissions’ in Category 15 can be found in tables further on.
Scope 3 GHG emissions (excluding category 15 ‘financed emissions’)1) | Unit | 2023 | 2024 | 2025 | Change from 2023 to 2025 | |||||
Purchased goods and services (category 1)2) | tCO2e | n. a. | 92 | 70 | n. a. | |||||
Paper3) | tCO2e | n. a. | 90 | 68 | ||||||
Water | tCO2e | 3 | 2 | 2 | ||||||
Energy- and fuel-related activities (category 3)4) | tCO2e | 175 | 254 | 226 | 29 % | |||||
Waste/wastewater (category 5) | tCO2e | 26 | 24 | 27 | 3 % | |||||
Waste | tCO2e | 24 | 23 | 26 | ||||||
Wastewater | tCO2e | 2 | 1 | 1 | ||||||
Business travel (category 6) | tCO2e | 51 | 48 | 45 | – 12 % | |||||
Public transport5) | tCO2e | 2 | 2 | 2 | ||||||
Road traffic5) | tCO2e | 49 | 43 | 37 | ||||||
Air travel6) | tCO2e | 0 | 3 | 6 | ||||||
Commuting (category 7)7) | tCO2e | 764 | 801 | 823 | 8 % | |||||
Working from home (category 7)8) | tCO2e | 4 | 4 | 4 | 8 % | |||||
Leased residential and business premises (category 13) | tCO2e | 413 | 200 | 224 | – 46 % |
1)Base year: 2023
The reported greenhouse gas emissions are gross volumes in tonnes of CO2 equivalents (tCO2e). Gross means before deducting any climate offsets. All greenhouse gas emissions from air travel were fully offset in the years shown.
Source of emission and energy factors: ‘Ecoinvent’ database V 3.7.1 as at October 2020 for 2014 to 2023, ‘Ecoinvent’ V 3.10 as at October 2023 from 2024 onwards; mobitool v3.0 (update 2023) for business and commuter travel. The ‘Ecoinvent’ database V 3.10 includes the following greenhouse gases: carbon dioxide (CO2), methane (CH4), nitrous oxide (N2O), hydrofluorocarbons (HFCs), perfluorocarbons (PFCs), sulphur hexafluoride (SF6) and nitrogen trifluoride (NF3); mobitool's emission factors take into account all greenhouse gases that are relevant for the calculation of CO2 equivalents in relation to road, rail and air transport.
Biogenic CO2 emissions: CO2 emissions from the combustion of biomass play an insignificant role in Scope 3 emissions in the company's own business operations. These emissions are therefore not reported separately.
Accounting is based on the Greenhouse Gas Protocol (GHG Protocol). Consolidation method: full consolidation of subsidiaries wholly owned by the parent company (see information on the scope of consolidation in the section «About this sustainability report»). Otherwise, there are no other investments to be consolidated.
The figures cover all locations within the Group.
Tools used: ‘VfU-Kennzahlen 2022’ calculation tool (version 1.1, update of 12.07.2022) for 2014 to 2023, ‘VfU-Kennzahlen 2024’ calculation tool from 2024 onwards (version 1.4 from 25.11.2024).
Other sources for calculation and disclosure: ‘VfU-Kennzahlen’ industry metric from the Verein für Umweltmanagement und Nachhaltigkeit in Finanzinstituten e.V., the GHG Protocol standards and the Global Reporting Initiative (GRI) standards. The categories listed in the table refer to the GHG Protocol. Categories not listed are immaterial for LUKB.
2)The table does not include greenhouse gas emissions from data centre services purchased externally. LUKB conducted a survey of the relevant data centre service providers on this topic in 2024. It showed that the proportionately attributable greenhouse gas emissions are immaterial for LUKB. This is because the services are largely powered by renewable energy sources; moreover, residual emissions are already fully carbon offset by some providers.
3)Includes copy and printer paper, envelopes, printed matter, forms, other office paper, cardboard products
4)As a result of energy supply, power plant pre-stage processes and distribution and conversion losses
5)Of which direct and indirect greenhouse gas emissions from energy supply in 2025 (Scope 1 and 2): 280 kgCO2e public transport (previous year: 245 kgCO2e), 27 563 kgCO2e road traffic (previous year: 32 105 kgCO2e); other indirect emissions for 2024 (Scope 3): 1 981 kgCO2e public transport (previous year: 1 733 kgCO2e), 9 090 kgCO2e road traffic (previous year: 10 587 kgCO2e); estimates based on SBB's 2023, 2024 and 2025 emissions reports (‘SBB Business Travel’) and expense reports, source of emission factors: mobitool v3.0 update 2023 (mobitool.ch) and SBB emissions reports.
6)Scope 1 to 3 greenhouse gas emissions in 2025 totalling 5 891 kgCO2e (previous year: 2 893 kgCO2e), of which Scope 1 and 2 totalling 5 756 kgCO2e (previous year: 2 827 kgCO2e); total flight distance in 2025 of approx. 22 400 km (previous year: approx. 11 000 km); the carbon emissions of all flights taken in 2023, 2024 and 2025 were fully offset. Net greenhouse gas emissions from air travel are therefore zero in these years.
7)Of which direct and indirect greenhouse gas emissions from energy supply in 2025 (Scope 1 and 2): 564 tCO2e (previous year: 549 tCO2e); other indirect emissions (Scope 3): 259 tCO2e (previous year: 252 tCO2e); estimates based on an employee survey on mobility behaviour conducted in July and August 2024; the next such survey will be conducted in the course of 2026; source of emission factors: mobitool v3.0 update 2023.
8)Estimate based on an employee survey on mobility behaviour conducted in July/August 2024 and assumptions for electricity consumption per employee per day when working from home (basis for energy consumption and emission factors: ‘VfU-Kennzahlen 2024’); the next such survey will be conducted in the course of 2026.
Category 1 – Paper: Total year-on-year paper consumption fell by 22 % and total envelope consumption by 9 % – see information about material consumption under ‘Procurement and waste disposal’ in the ‘Other topics’ section.
Category 3 – Energy and fuel-related activities: This item includes emissions from energy use, preliminary stages relating to power plants as well as losses from distribution and conversion. These emissions have decreased slightly year-on-year.
Category 7 – Commuting and working from home: The increase in emissions from commuting is solely attributable to the increase in average full-time employee numbers from 1,106.4 in 2023, to 1,160.0 in 2024, and to 1,191.7 in 2025. The underlying mobility behaviour over the three years is based on the same employee survey. Emissions from working from home are calculated using estimates that are also based on this survey. The next employee survey on mobility behaviour will be conducted in 2026.
Category 13 – Leased residential and business premises: Emissions have fallen by 46 % since 2023 as a result of switching from fossil heating to district heating and heat pumps.
Apart from emissions in Category 15 (‘Financed emissions’; see section below), other Scope 3 emissions are of minor importance at LUKB.
Scope 3 greenhouse gas emissions – financed emissions
Lending business
LUKB uses the international Partnership for Carbon Accounting Financials (PCAF) standard when calculating and disclosing financed emissions from its lending business. In this connection, it applies the PCAF standards for mortgages on residences and commercial real estate and for business loans. LUKB has defined these three lending portfolios as follows in accordance with the PCAF requirements:
Lending portfolio | Definition | |
Mortgages | Lending to finance mostly owner-occupied residential properties. This mainly involves single-family homes, apartments, holiday homes and multiple-family properties with up to three apartments. | |
Commercial real estate mortgages | Lending to finance other land with buildings with a purpose of income generation. This relates primarily to multiple-family properties with more than three apartments, commercial properties, industrial properties, hotels and restaurants, and agricultural properties. | |
Business loans | Lending to finance premises that form the basis for a business's operations (e.g. hotel, running a garage, etc.) and companies without mortgage cover |
The definitions of the three portfolios differ from those LUKB normally uses for these types of lending.
As at 31 December 2025, the three portfolios accounted for 93 % of all loans to clients. No PCAF calculation standards currently apply to the remaining 7 % of loans to clients (including loans for building land, public-sector loans and Lombard loans).
The following table shows the emissions for the three lending portfolios:
GHG emissions lending business1) | Unit | 2023 | 2024 | 2025 | ||||
Mortgages2) | ||||||||
Lending volume at year-end | CHF thousand | 13,633,875 | 14,210,326 | 14,866,357 | ||||
Absolute Scope 1 and 2 GHG emissions3) | tCO2e | 79,117 | 74,634 | 66,946 | ||||
Scope 1 and 2 CO2 footprint4) | tCO2e/million CHF | 5.8 | 5.3 | 4.5 | ||||
CO2 intensity in relation to the energy reference area (ERA) | kgCO2e/m2 ERA | 30.3 | 29.5 | 26.8 | ||||
Portfolio coverage in relation to calculated GHG emissions5) | % | 100 % | 100 % | 100 % | ||||
PCAF data quality score6) | Scale 1.0 to 5.0 | 4.0 | 4.0 | 4.0 | ||||
Commercial real estate mortgages2) | ||||||||
Lending volume at year-end | CHF thousand | 22,965,976 | 23,951,488 | 25,618,571 | ||||
Absolute Scope 1 and 2 GHG emissions3) | tCO2e | 165,278 | 143,508 | 137,288 | ||||
Scope 1 and 2 CO2 footprint4) | tCO2e/million CHF | 7.2 | 6.0 | 5.4 | ||||
CO2 intensity in relation to the energy reference area (ERA) | kgCO2e/m2 ERA | 27.0 | 26.8 | 25.0 | ||||
Portfolio coverage in relation to calculated GHG emissions5) | % | 100 % | 100 % | 100 % | ||||
PCAF data quality score6) | Scale 1.0 to 5.0 | 4.0 | 4.0 | 4.0 | ||||
Business loans7) | ||||||||
Lending volume at year-end | CHF thousand | 2,303,166 | 2,328,565 | 2,650,307 | ||||
Total absolute GHG emissions8) | tCO2e | 864,913 | 863,667 | 874,901 | ||||
of which Scope 1 and 2 | tCO2e | 332,656 | 331,218 | 289,882 | ||||
of which Scope 3 | tCO2e | 532,257 | 532,449 | 585,019 | ||||
Scope 1 and 2 CO2 footprint4) | tCO2e/million CHF | 144.4 | 142.2 | 109.4 | ||||
Portfolio coverage | ||||||||
Scope 1 and 2 emissions calculated5) | % | 100 % | 100 % | 100 % | ||||
Scope 3 emissions calculated5) | % | 93 % | 95 % | 94 % | ||||
PCAF data quality score6) | Scale 1.0 to 5.0 | 3.7 | 3.6 | 3.6 |
1)Base year: 2023
2)The financed greenhouse gas emissions of mortgages are calculated on the basis of the cut-off date of 31 December. For both reporting years, they were calculated in collaboration with an external Swiss data service provider specialising in real estate, which supplemented LUKB's database for the financed building portfolio with further data (e.g. energy reference areas, energy requirements, CO2 emissions) where necessary and possible. Some of the energy- and climate-related inputs required for the calculations come from the Swiss Federal Register of Buildings and Dwellings (RBD). Where there was no data or data was subject to uncertainty, the calculation was based on own weighted average values at different levels (e.g. ‘Property type and location of building’, ‘Property type only’) or LUKB had to make further assumptions. To further improve the quality and completeness of data in the RBD, various measures are currently being implemented by the relevant public bodies.
3)The applicable PCAF standards only require the disclosure of Scope 1 and 2 emissions for mortgages and commercial real estate mortgages. A PCAF standard for calculating Scope 3 emissions from financed buildings is not yet available. Apart from CO2 emissions, no other greenhouse gas emissions were taken into account in the mortgage data.
4)Greenhouse gas emissions in tonnes of CO2 equivalents (tCO2e) per million francs of lending volume
5)Volume-weighted
6)The PCAF data quality score measures the quality and reliability of the data used to calculate financed emissions. The rating scale ranges from 1 to 5, with 1 being the highest quality and reliability and 5 being the lowest. The reported scores are volume-weighted averages for the relevant lending portfolio.
7)The greenhouse gas emissions financed by business loans are also calculated on the basis of the cut-off date of 31 December. For emissions data with PCAF data quality scores 1 and 2, the calculations are based on greenhouse gas balance sheets reported by the companies, for data with PCAF data quality scores 3 and 4, the calculations are based on Exiobase sector-specific emission factors from the PCAF database.
8)In the case of business loans, some of the reported greenhouse gas emissions are subject to greater uncertainty in estimation, in particular the companies' Scope 3 emissions. They can be strongly influenced by individual outliers, which can potentially lead to high volatility in the data over time.
LUKB aims to reduce the CO2 intensity in relation to the energy reference area (kgCO2e/m2 ERA) by 40 % in its residential and commercial mortgages portfolios by 2030 compared with the base year 2023 (see the ‘Climate strategy/climate transition plan’ section). The degree of target achievement by the end of 2025 is shown below:
Mortgages: CO2 intensities – progress towards target achievement1) | Unit | 2023 | 2024 | 2025 | Change from 2023 to 2025 | |||||
Mortgages | ||||||||||
CO2intensity2) | kgCO2e/m2 ERA | 30.3 | 29.5 | 26.8 | – 11.6 % | |||||
Commercial real estate mortgages | ||||||||||
CO2intensity2) | kgCO2e/m2 ERA | 27.0 | 26.8 | 25.0 | – 7.4 % |
1)Base year: 2023
2)Defined as the sum of CO2 emissions Scope 1 and 2 per m2 energy reference area (ERA)
The CO2 emissions reported for mortgages are mainly based on publicly available information on the condition of the building from the Register of Buildings and Dwellings (RBD). Complete data on the energy efficiency of the financed buildings – e.g. renovations of façades, windows, roofs and basement ceilings – is currently lacking, and information about heating systems is often out of date. On a positive note, Canton Lucerne and its municipalities have intensified their updating of RBD data, which should further improve data quality in future.
An overview of the energy efficiency of the financed buildings based on the available data can be found in ‘Energy efficiency of financed buildings’ in the ‘Lending business’ section.
To enable more realistic emission estimates, LUKB has worked with a Swiss data service provider specialising in real estate to develop a model based on the federal government's PACTA climate compatibility test. The model takes into account the years of construction of the buildings and life cycles of components and assumes that renovation and replacement investments have been or will be made. Cantonal statutory requirements for renovations and assumptions for switching to climate-friendly heating systems are also included in the model. The values the model generates are used for validating the calculations internally and provide the basis for further measures.
The lending portfolio by emission-intensive sectors breaks down as follows:
31.12.2023 | 31.12.2024 | 31.12.2025 | ||||||||||
Breakdown of lending portfolio by emission-intensive sectors | Lending volume (CHF thousand) | Share in % | Lending volume (CHF thousand) | Share in % | Lending volume (CHF thousand) | Share in % | ||||||
Total loans in the three loan categories | 38,903,017 | 100.0 % | 40,490,379 | 100.0 % | 43,135,235 | 100.0 % | ||||||
Mortgage portfolio | 36,599,851 | 94.1 % | 38,161,814 | 94.2 % | 40,484,928 | 93.9 % | ||||||
Mortgages | 13,633,875 | 35.0 % | 14,210,326 | 35.1 % | 14,866,357 | 34.5 % | ||||||
Commercial real estate mortgages | 22,965,976 | 59.0 % | 23,951,488 | 59.2 % | 25,618,571 | 59.4 % | ||||||
Business loans | 2,303,166 | 5.9 % | 2,328,565 | 5.8 % | 2,650,307 | 6.1 % | ||||||
Total emission-intensive sectors1) | 571,713 | 1.5 % | 623,587 | 1.5 % | 859,184 | 2.0 % | ||||||
Energy | 43,796 | 0.1 % | 48,492 | 0.1 % | 40,834 | 0.1 % | ||||||
Oil and gas | 0 | 0.0 % | 0 | 0.0 % | 0 | 0.0 % | ||||||
Coal | 0 | 0.0 % | 0 | 0.0 % | 0 | 0.0 % | ||||||
Power generation | 43,796 | 0.1 % | 48,492 | 0.1 % | 40,834 | 0.1 % | ||||||
Transport | 179,866 | 0.5 % | 163,259 | 0.4 % | 202,305 | 0.5 % | ||||||
Aviation | 0 | 0.0 % | 370 | 0.0 % | 320 | 0.0 % | ||||||
Shipping | 0 | 0.0 % | 0 | 0.0 % | 0 | 0.0 % | ||||||
Rail transport | 5,920 | 0.0 % | 2,923 | 0.0 % | 3,922 | 0.0 % | ||||||
Road transport | 78,592 | 0.2 % | 52,876 | 0.1 % | 48,332 | 0.1 % | ||||||
Automotive industry | 95,353 | 0.2 % | 107,090 | 0.3 % | 149,731 | 0.3 % | ||||||
Construction and materials | 293,762 | 0.8 % | 311,011 | 0.8 % | 506,226 | 1.2 % | ||||||
Metals and mining including aluminium, iron and steel | 95,970 | 0.2 % | 92,163 | 0.2 % | 60,891 | 0.1 % | ||||||
Chemicals | 85,968 | 0.2 % | 83,418 | 0.2 % | 101,582 | 0.2 % | ||||||
Building materials including cement | 69,856 | 0.2 % | 64,641 | 0.2 % | 57,449 | 0.1 % | ||||||
Construction of real estate, real estate activities | 41,968 | 0.1 % | 70,789 | 0.2 % | 286,303 | 0.7 % | ||||||
Agriculture and forestry, food | 54,290 | 0.1 % | 100,825 | 0.2 % | 109,820 | 0.3 % | ||||||
Beverage industry | 222 | 0.0 % | 219 | 0.0 % | 4 | 0.0 % | ||||||
Agriculture | 1,705 | 0.0 % | 1,248 | 0.0 % | 784 | 0.0 % | ||||||
Foodstuffs | 48,785 | 0.1 % | 94,448 | 0.2 % | 95,945 | 0.2 % | ||||||
Forestry and forestry products | 3,578 | 0.0 % | 4,910 | 0.0 % | 13,087 | 0.0 % |
1)Emission-intensive sectors as per TCFD recommendations: energy, transportation, materials and buildings, agriculture, food and beverages, forest products (see TCFD Implementing Guidance, Part E: Supplemental Guidance for Non-Financial Groups, p. 56 et seqq., October 2021); loans are allocated to the individual sectors using NOGA codes, which classify the borrowers' operating sector.
Financial assets
The financial asset portfolio consists predominantly of bonds with the highest liquidity level that qualify as high-quality liquid assets (HQLA). Bond issuers can largely be attributed to the financial sector.
Financial assets1) | Unit | 2023 | 2024 | 2025 | ||||
Assets held at year-end (fair value) | CHF thousand | 4,932,270 | 5,229,265 | 5,372,011 | ||||
of which funds, structured products and money market papers | CHF thousand | – 279,042 | – 337,443 | – 333,220 | ||||
Direct investments at year-end | CHF thousand | 4,653,228 | 4,891,821 | 5,038,791 | ||||
of which investments not covered by PCAF standards2) | CHF thousand | – 1,082,665 | – 860,565 | – 720,820 | ||||
Direct investments covered by PCAF standards at year-end | CHF thousand | 3,570,563 | 4,031,256 | 4,317,971 | ||||
of which listed equities | CHF thousand | 157,749 | 125,947 | 146,046 | ||||
of which corporate bonds | CHF thousand | 3,386,615 | 3,873,144 | 4,104,505 | ||||
of which government bonds | CHF thousand | 26,200 | 32,165 | 67,420 | ||||
Total absolute GHG emissions3) | tCO2e | 233,128 | 149,199 | 164,498 | ||||
of which Scope 1 and 2 | tCO2e | 13,159 | 39,108 | 13,837 | ||||
of which Scope 3 | tCO2e | 219,969 | 110,091 | 150,661 | ||||
Scope 1 and 2 CO2 footprint4) | tCO2e/million CHF | 3.69 | 9.70 | 3.20 | ||||
Portfolio coverage | ||||||||
Scope 1 and 2 emissions calculated5) | % | 100.00 % | 100.00 % | 99.99 % | ||||
Scope 3 emissions calculated5) | % | 100.00 % | 100.00 % | 99.99 % | ||||
PCAF data quality score6) | Scale 1.0 to 5.0 | 4.70 | 3.73 | 3.66 | ||||
Total direct investments in the three most emission-intensive sectors5) 7) | % | 0.50 % | 0.10 % | 0.12 % | ||||
Energy8) | % | 0.00 % | 0.00 % | 0.00 % | ||||
Raw and basic materials9) | % | 0.15 % | 0.09 % | 0.11 % | ||||
Utilities10) | % | 0.34 % | 0.01 % | 0.01 % |
1)Base year: 2023. Source of emission factors and tool used to calculate the emissions and PCAF data quality scores: MSCI Total Portfolio Footprinting Solution
2)Mainly bonds issued by sub-sovereign borrowers (e.g. cantons, municipalities, provinces, etc.) and development banks
3)Some of the greenhouse gas emissions are subject to greater uncertainty in estimation. They can be strongly influenced by individual outliers, which can potentially lead to high volatility in the data over time.
4)Greenhouse gas emissions in tonnes of CO2 equivalents (tCO2e) per million francs of direct investment at year-end covered by PCAF standards
5)As a % of direct investment at year-end covered by PCAF standards for calculation
6)The PCAF data quality score measures the quality and reliability of the data used to calculate financed emissions. The rating scale ranges from 1 to 5, with 1 being the highest quality and reliability and 5 being the lowest. The reported scores are volume-weighted averages for the relevant investment portfolio. The scores shown here refer to the emissions reported for Scope 1 to 3.
7)Most emission-intensive sectors (in descending order) according to a 2023 study by MSCI ESG Research. Securities holdings are allocated to individual sectors using the issuers' GICS (Global Industry Classification Standard) codes.
8)Energy (GICS sector code 10 Energy): companies operating in the oil, gas, coal and other non-renewable fuels sectors. Excludes energy suppliers included in utilities.
9)Raw and basic materials (GICS Sector Code 15 Materials): companies operating in the chemical, building materials, containers and packaging, metals and mining, paper and forest products sectors
10)Utilities (GICS sector code 55 Utilities): electricity, gas and other utilities
Investments
Non-consolidated investments | Unit | 2023 | 2024 | 2025 | ||||
Carrying amount at year-end | CHF thousand | 31,092 | 29,045 | 28,343 | ||||
Total absolute GHG emissions1) | tCO2e | 264 | 252 | 427 | ||||
of which Scope 1 and 2 | tCO2e | 101 | 99 | 98 | ||||
of which Scope 3 | tCO2e | 163 | 153 | 328 | ||||
PCAF data quality score2) | Scale 1.0 to 5.0 | 4.7 | 4.7 | 4.7 |
1)Base year: 2023. The calculations are based on companies' greenhouse gas balance sheets (data quality scores 1 and 2) and Exiobase's sector-specific emission factors from the PCAF database (data quality scores 3 and 4). Cut-off date: 31 December.
2)The PCAF data quality score measures the quality and reliability of the data used to calculate financed emissions. The rating scale ranges from 1 to 5, with 1 being the highest quality and reliability and 5 being the lowest. The reported scores are volume-weighted averages for the relevant investment portfolio.
The year-on-year increase in GHG emissions is due to the increased availability of Scope 3 emissions data for an investment.
Own investment funds (LUKB Expert Fund)
LUKB Expert Funds1) | Unit | 2023 | 2024 | 2025 | ||||
Investments at year-end (market values) | CHF thousand | 4,964,941 | 5,717,230 | 6,518,015 | ||||
of which cash, third-party funds, precious metals, derivatives and structured products | CHF thousand | – 861,822 | – 1,010,252 | – 1,212,035 | ||||
Direct investments at year-end | CHF thousand | 4,103,119 | 4,706,978 | 5,305,980 | ||||
of which investments not covered by PCAF standards | CHF thousand | – 319,583 | – 256,551 | – 112,899 | ||||
Direct investments covered by PCAF standards at year-end | CHF thousand | 3,783,536 | 4,450,427 | 5,193,081 | ||||
of which listed equities | CHF thousand | 2,115,847 | 2,685,057 | 3,010,314 | ||||
of which corporate bonds | CHF thousand | 1,371,897 | 1,311,668 | 1,711,686 | ||||
of which government bonds | CHF thousand | 295,791 | 453,702 | 471,080 | ||||
Total absolute GHG emissions | tCO2e | 1,166,017 | 1,488,360 | 1,730,704 | ||||
of which Scope 1 and 2 | tCO2e | 231,858 | 269,404 | 243,186 | ||||
of which Scope 3 | tCO2e | 934,159 | 1,218,955 | 1,487,518 | ||||
Scope 1 and 2 CO2 footprint | tCO2e/million CHF | 61.28 | 60.53 | 46.83 | ||||
Portfolio coverage | ||||||||
Scope 1 and 2 emissions calculated | % | 99.57 % | 98.58 % | 99.62 % | ||||
Scope 3 emissions calculated | % | 99.57 % | 98.42 % | 99.62 % | ||||
PCAF data quality score | Scale 1.0 to 5.0 | 2.90 | 2.65 | 2.66 | ||||
Total direct investments in the three most emission-intensive sectors | % | 7.69 % | 6.89 % | 7.07 % | ||||
Energy | % | 1.64 % | 1.46 % | 1.19 % | ||||
Raw and basic materials | % | 3.97 % | 3.79 % | 3.96 % | ||||
Utilities | % | 2.09 % | 1.64 % | 1.92 % |
1)The same explanations and notes apply with regard to data sources, calculation tools and definitions as for financial assets (see table above).
Portfolio management (standard and individual mandates)
Portfolio management1) | Unit | 2023 | 2024 | 2025 | ||||
Assets under management (AuM) at year-end (market values) | CHF thousand | 3,071,000 | 3,620,268 | 4,124,431 | ||||
of which cash, funds, precious metals, derivatives and structured products | CHF thousand | – 2,433,189 | – 2,832,033 | – 3,254,948 | ||||
Direct investments at year-end | CHF thousand | 637,811 | 788,235 | 869,483 | ||||
of which investments not covered by PCAF standards | CHF thousand | – 53,398 | – 208,441 | – 23,853 | ||||
Direct investments covered by PCAF standards at year-end | CHF thousand | 584,413 | 579,794 | 845,630 | ||||
of which listed equities | CHF thousand | 165,572 | 283,379 | 451,931 | ||||
of which corporate bonds | CHF thousand | 411,966 | 296,415 | 386,672 | ||||
of which government bonds | CHF thousand | 6,875 | 0 | 7,027 | ||||
Total absolute GHG emissions | tCO2e | 90,885 | 120,595 | 380,698 | ||||
of which Scope 1 and 2 | tCO2e | 20,798 | 20,006 | 19,179 | ||||
of which Scope 3 | tCO2e | 70,086 | 100,590 | 361,520 | ||||
Scope 1 and 2 CO2 footprint | tCO2e/million CHF | 35.59 | 34.50 | 22.68 | ||||
Portfolio coverage | ||||||||
Scope 1 and 2 emissions calculated | % | 99.84 % | 99.07 % | 99.83 % | ||||
Scope 3 emissions calculated | % | 99.84 % | 99.07 % | 99.83 % | ||||
PCAF data quality score | Scale 1.0 to 5.0 | 3.47 | 2.50 | 2.59 | ||||
Total direct investments in the three most emission-intensive sectors | % | 5.93 % | 8.45 % | 6.86 % | ||||
Energy | % | 0.67 % | 0.00 % | 0.01 % | ||||
Raw and basic materials | % | 2.05 % | 5.92 % | 4.27 % | ||||
Utilities | % | 3.21 % | 2.53 % | 2.58 % |
1)The same explanations and notes apply with regard to data sources, calculation tools and definitions as for financial assets (see table above).
Climate compatibility tests
In 2024, the Federal Office for the Environment (FOEN) carried out the climate compatibility test for the Swiss financial centre for the fourth time in collaboration with the State Secretariat for International Finance (SIF). The standardised Paris Agreement Capital Transition Assessment (PACTA) method was again applied in the 2024 test. The test is intended to show how climate friendly the portfolios are of the participating Swiss financial institutions. The previous tests were conducted in 2017, 2020 and 2022. Participation in 2024 was once again voluntary for the financial institutions. LUKB took part for the third time in 2024. A total of 146 institutions from the financial sector took part, including 34 banks.
The 2024 evaluation consisted of two quantitative modules and one qualitative survey. One quantitative module analysed exposure to listed equities and corporate bonds in climate-relevant sectors and assessed their alignment with global climate scenarios. The other quantitative module assessed the compliance of Swiss real estate and mortgage portfolios with national climate targets. The qualitative survey covered additional climate-relevant strategies and activities in the different business areas of the participating financial institutions.
No climate compatibility test was carried out in 2025.
Risks and opportunities
As in the previous year, LUKB follows the recommendations of the former Task Force on Climate-related Financial Disclosures (TCFD)1) for the next section of the report on the risks and opportunities of climate change.
Climate-related risks
Climate-related risks are part and parcel of LUKB's Group-wide risk management. Over the past two years, key basic documents have been drawn up to determine the organisational, methodological, procedural and governance procedures for managing climate-related risks.
LUKB does not regard climate risks as an additional category but as a risk driver. It influences the default, market, liquidity, operational, compliance, strategic and reputational risk categories through various potential events.
To identify and assess these effects, LUKB compiled a comprehensive risk inventory of climate risks in 2024, which it expanded and updated in 2025. The risk assessment distinguishes between physical and transition climate risks in accordance with the TCFD recommendations.
Physical climate risks
Physical risks result from the physical effects of climate change and the associated impairment of ecosystem services. Physical risks can be acute or chronic or both. Acute physical risks result from extreme events such as floods, storms, droughts, wildfires, landslides and pandemics. Chronic physical risks result from permanent natural changes such as rising average temperatures, changes in precipitation patterns, rising sea levels, pollution of air, water or soil; deforestation, species extinction, and the spread of invasive species.
Transition climate risks
Transition climate risks, also known as transition risks, arise from switching to a climate-friendly economy – in particular in connection with decarbonisation, e.g. through changes in climate and environmental policy, technological developments, revision of laws, and changes in the behaviour of market participants.
The long-term nature of climate change makes distinguishing between different timescales especially important when assessing risk. LUKB has assessed its climate-related financial risks based on the following timescales:
- Short term: 0 to 4 years
- Medium term: 5 to 15 years
- Long term: 16 to 30 years
According to its current assessment, LUKB expects the risks associated with climate change to have only a limited effect on its business and financial performance. The effects of climate change depend heavily on the business model. In line with the Canton of Lucerne's Ownership Strategy, LUKB acts as a full-service bank, primarily for the people and economy of the Canton of Lucerne. Geographically, its activities are limited to Switzerland. Only a few clients are domiciled abroad. LUKB's income and financial risks are broadly diversified.
The table below shows the assessment made in 2025 of the short-, medium- and long-term effects of climate-related risks on LUKB:
Short-term | Medium-term | Long-term | ||||
Physical climate risks | ||||||
Default risks | low | low | low | |||
Market risks | low | low | low | |||
Operational risks | low | low | low | |||
Other risks | low | low | low | |||
Transition climate risks | ||||||
Default risks | low | medium | medium | |||
Market risks | low | low | low | |||
Operational risks | low | low | low | |||
Other risks | low | low | low |
Rating scale: (1) low risk, (2) medium risk, (3) high risk
There are currently no high risks in the climate risk inventory. The risk analyses indicate a low climate-related risk for LUKB in the short term. This applies to both transition and physical risks. In the medium to long term, however, LUKB expects climate-related risks to become more important, primarily with regard to the potential effects of climate change on default risks. Compared to other non-climate-related risks and measured against LUKB's own funds; however, these climate-related risks are also currently rated as relatively low.
Effects of physical risks on default risks
Physical risks may cause the value of loan collateral (e.g. for mortgages, the value of financed properties) and/or the affordability of financing costs to decrease. For example, a higher risk of flooding can negatively effect the value of property in an area. A flood can also result in high repair costs. Businesses can suffer a loss of income due to business interruptions and supply chain issues.
In addition to these microeconomic effects, macroeconomic effects are also a possibility. Higher physical risks can, for example, weaken the economy and influence supply and demand in the markets.
In terms of value, the majority of the properties financed by LUKB are located in the Canton of Lucerne and in neighbouring regions of the Swiss Plateau. By comparison, the proportion of financed properties in mountain regions that are particularly affected by physical risks (e.g. due to landslides and rockfalls) is low.
Building damage caused by natural hazards (e.g. floods, storms, landslides, rockfalls) is covered by mandatory building insurance in most cantons in Switzerland. In cantons without mandatory building insurance, LUKB requires similar cover from private insurers. As long as insurance premiums do not rise sharply, acute physical risks should therefore not have a significant effect on the value of buildings and the affordability of mortgages. In addition, Switzerland's building and zoning regulations ensure that construction is not generally carried out in areas at high risk.
In 2025, LUKB calculated the effects of a flood scenario on the mortgage portfolio based on the cantonal flood hazard maps (intensity maps). This quantitative analysis examined the effect on the value of the collateral and the need for specific value adjustments:
Scenario | Flooding in the cantons of Lucerne, Aargau, Bern, Basel-Stadt, Zug and Zurich | |
Portfolio | Mortgages and commercial real estate mortgages. More than 85 % of the value of the real estate collateral in LUKB's mortgage portfolio is situated in the above cantons. | |
Transmission channel | Changes in property prices in line with the 2022 Climate Stress Test of the European Central Bank (ECB), depending on the risk levels of financed property locations. No account was taken of any additional precautions in the form of structural measures to prevent flooding, which would provide additional protection to the value of the properties in question. | |
Impact on risks | Change in value of collateral: if the value of a property falls, the loan-to-value ratio increases correspondingly. The higher loan-to-value ratio potentially leads to a higher specific impairment requirement. | |
Result of the analysis | The additional specific impairment required based on the updated scenario analysis would be easily manageable for LUKB. |
acute physical consequences of climate change (e.g. floods, storms, landslides) can cause damage to company buildings and equipment and lead to business interruptions. Such events are usually geographically limited, meaning that only a small part of LUKB's lending portfolio would be affected. In addition, business interruption insurance (if any) would mitigate the risks.
Chronic developments (e.g. water scarcity, soil degradation and biodiversity loss) can put clients' business models at risk. LUKB does not expect any significant effect on its business lending portfolio in the short to medium term. Based on its current assessment, LUKB does not anticipate any significant risks in the longer term either, as it does not have a particularly high proportion of financing in potentially more heavily affected sectors and its lending portfolio is broadly diversified.
Overall, LUKB does not expect any significant increase in loan defaults due to physical risks in the short to medium term. In the long term, climate risks could become more important due to rising insurance premiums and potential real estate depreciation. However, based on the current assessment, these developments are unlikely to have any material effect on LUKB's lending portfolio. LUKB will monitor further developments in this area and take action early on as needed.
Effect of transition risks on default risks
Like physical climate risks, transition climate risks can also affect credit risks. Examples include the depreciation of properties heated using fossil fuels or higher operating costs due to rising CO2 taxes or energy prices. Companies may need to adapt their business activities and production processes, which involves a high level of investment. Without these adjustments, assets may lose value. In this respect, the transition to a low-emission economy can have a significant effect on the profitability of companies.
Rising carbon taxes and energy prices can lead to lower sales and/or higher operating costs, which can result in collateral depreciation and loan defaults. However, simulations of such scenarios show that LUKB would be able to manage these effects well – even if CO2 taxes were to rise sharply. LUKB only has low lending volumes in emission-intensive sectors (see table above in the ‘Scope 3 greenhouse gas emissions – financed emissions’ section). As a result, rising taxes on greenhouse gas emissions have only a moderate effect on credit default risk for most corporate clients. Even if there are sharp price increases, the simulations do not show any significant effect on the lending portfolio.
in 2025, LUKB again calculated a scenario of a significant increase in CO2 taxes over the next five years. It based it on the updated scenarios of the Network for Greening the Financial System (NGFS) – an association of central banks and supervisory authorities that analyses the effects of climate change on the global financial system. Since last year's scenario analysis, these scenarios have been significantly refined. For the following quantitative analysis, LUKB used the new assumptions and examined the effect on the creditworthiness of the financed companies, the value of the mortgage guarantees and the need for specific valuation allowances in the loan portfolio:
Scenario | Significant increase in carbon taxes in Switzerland over a period of five years | |
Portfolio | Entire lending portfolio | |
Transmission channel | Two transmission channels were considered:
| |
Impact on risks | Downgrades to company ratings and a decline in the value of mortgage collateral could potentially lead to increased specific impairment requirements. | |
Result of the analysis | The additional specific impairment required in the NGFS adverse ‘Delayed Transition’ scenario would be easily manageable for LUKB based on the updated scenario analysis and low compared to the annual Bank-wide stress test. Even in an unexpected highly negative stress scenario with deliberately more negative assumptions than in the NGFS adverse scenario, the specific impairment would be easily manageable for LUKB. |
LUKB also assumes that restrictive climate-related laws and regulations with an abrupt effect on lending are unlikely in the Swiss political system, in which direct democracy is a key element. Under the rule of law in Switzerland, political decisions are made in close consultation with stakeholders. Such processes are generally designed so that the economy and society can adapt to major changes and that appropriate hardship measures are implemented in particularly serious cases. As a result, significant defaults of mortgage and corporate clients due to new, abrupt regulatory changes are unlikely.
LUKB also assessed any technological risks arising from climate change. LUKB expects innovation cycles for corporate clients to become even shorter in the future, leaving less time for companies to react. The risk driver could potentially present affected companies with challenges that threaten their very existence. However, LUKB does not expect any significant effects on its default risks in the longer term either, as it assumes that this risk only affects part of its lending portfolio and that LUKB has a broadly diversified business lending portfolio. LUKB will also closely monitor further developments in this area and take action early on where necessary.
Overall, LUKB does not expect any significant increase in loan defaults over any timescale due to transition risks.
Effect on market risks
Market risk refers to the loss potential resulting from unfavourable changes in interest rates, share prices, foreign exchange and cryptocurrency rates and real estate prices as well as other relevant market parameters such as volatilities. Market risks are present in both LUKB's banking and trading books. Physical and transition risks can lead to unexpected changes in these market parameters and thus influence market risk.
LUKB invests its financial assets mainly in Swiss mortgage bonds and bonds issued by public-sector borrowers. These companies are less affected by market risks than, for example, companies in emission-intensive sectors. The effects of climate-related risks on market risks affecting the financial asset portfolio is therefore limited for LUKB.
Market risks in the trading book are significantly limited by short holding periods, appropriate volume and risk limits and corresponding hedging transactions. As a result, the effects of climate change on market risks in the trading book is low.
Effect on operational risks
Transition risks in banking operations
Increasing awareness of climate issues and new legal and regulatory requirements place additional demands on LUKB, for example in terms of data collection, reporting and advisory services. This increases LUKB's operational risk, particularly as a result of growing compliance risks. LUKB therefore has an ongoing interest in the development of legal and regulatory requirements and, if necessary, adapts its internal requirements and climate risk management. Overall, LUKB classifies the risks as low.
Physical risks for banking operations
Climate change increases operational risks due to physical events such as flooding, which can cause damage to the Bank's buildings or critical infrastructure. All buildings that LUKB uses for its operations are located in Switzerland and have standard building insurance cover. LUKB also takes physical measures to protect itself (e.g. against floods). Unavoidable risks are largely insured.
Operational risk management and business continuity management (BCM) ensure that LUKB can maintain business-critical processes even in extraordinary situations, minimise potential damage and ensure that operations are resumed quickly in the event of an emergency.
Overall, LUKB believes its operations have little exposure to climate risks.
Effect on other risks
Other risks include, in particular, strategic and reputational risks. Due to its business model, LUKB considers the strategic risks posed by climate change to be low. As awareness among the general public, clients and other stakeholders increases, expectations of sustainable business practice grow. This also increases the risk of reputational damage. Sustainability therefore is a key element of LUKB's strategy. As LUKB attaches great importance to sustainability and provides transparent information; it considers the overall reputational risk to be low.
Climate-related opportunities
In accordance with the TCFD recommendations, LUKB distinguishes among five categories of opportunities: markets, products and services, resource efficiency, energy sources, and resilience.
Markets, products and services
Climate change is associated with a high level of investment needed to finance the transition to a more climate-friendly economy and society. In the building sector, for example, significant further investments must be made in renovating the building envelope and replacing the heating system. It can therefore be assumed that demand from property owners and companies for financing to improve climate compatibility will continue to increase in the future to meet Switzerland's climate targets. This opens up opportunities to support clients with such financing projects.
LUKB already supports real estate clients with measures to preserve long-term value and improve the energy efficiency of real estate. An overview of LUKB's approach and the corresponding products and services can be found in the ‘Lending business’ section.
In addition, LUKB already responded to clients' need for sustainable investment and pension products in 2022 and systematically aligned its investment and fund business with sustainability criteria (ESG criteria; environment, social, governance). An overview of the products and services can be found in the ‘Investment business’ section.
Resource efficiency
LUKB's aim is to use natural resources carefully and efficiently in its banking operations and to gradually reduce the potential negative effect on the environment as far as possible, thereby also cutting costs. As banking operations are not particularly energy intensive, the effect of this opportunity on the Bank's financial results is considered to be relatively low.
An overview of the measures in the area of energy efficiency can be found below. In addition, ‘Procurement and waste disposal’ in the ‘Other topics’ section has further information on measures relating to waste as well as material and water consumption.
Energy sources
Sustainable and renewable energy sources enable LUKB to cut both operational emissions and costs. It already obtains all of its electricity from renewable energy sources and produces energy from solar panels at various business locations. In the coming years it plans to further expand its electricity production potential (see the explanations below).
Resilience
By taking a conscious approach to climate change, LUKB can take preventative measures to strengthen its resilience in the long term. Sustainability and climate change are firmly embedded in the corporate strategy. Integrating climate-related financial risks into risk management also increases resilience. As the market leader in the Lucerne economic region and as a major employer, LUKB is aware of its responsibility and acts proactively and with a focus on the future as a result.
Risk management
As a financial institution, LUKB is confronted with various bank-specific risks: these include default, market, liquidity, operational, compliance, strategic and reputational risks. Sustainability risks and their climate-related financial risks are not a standalone risk category but rather a driver of these risk categories.
The ‘Risk management’ section in the notes to the Group financial report contains further information about the risk policy, the organisation and governance of risk management, the individual risk categories and how risks are managed.
Every year the Risk Control function, together with an expert committee from the first line of defence, carries out a qualitative assessment of the effects of climate risks as drivers for the risk categories default, market, liquidity, operational, compliance, strategy and reputational risks. The first-line-of-defence expert committee consists of the Sustainability Office, Credit Risk Management, Finance & Investment Management Support and the Asset Management Sustainability Office.
The overall risk management process with regard to climate risks at LUKB is as follows:
a) Identification
This process step involves identifying climate-related physical and transition risks. Physical and transition climate risks are explained in the section above.
The aim of this step is to identify and understand the potential risks to which LUKB is exposed. This step takes into account, among other things, developments in the environment, politics, regulation, technology and markets.
The individual risks are documented in a risk inventory.
b) Measurement and assessment
The aim of this process step is to assess the effects of climate change on LUKB's risk profile. The evaluation is mainly qualitative. First of all, possible transmission channels for individual risks are assessed, such as property damage, loss of income, additional expenses, changes in assets and market changes.
On this basis, the materiality of the risks is assessed, taking into account risk exposures. The sources of income and expenses, assets and possible risk mitigations (e.g. insurance policies, behaviour of stakeholders, public-sector measures) are taken into account. Finally, the extent of the effect on the defined risk categories and their sub-categories is assessed. Risk assessment classes (‘materiality levels‘) are defined and applied for this purpose.
For specific portfolios with increased risk exposure to climate-related financial risks, quantitative scenario analyses are carried out periodically where possible and appropriate.
c) Management
Risk management aims to steer and manage climate risks effectively and efficiently throughout the Group. The risk management measures are defined and implemented by the respective risk owners within the existing risk categories.
As climate risks are currently classified as low (‘low’ to ‘medium’ according to LUKB's climate risk inventory; see the explanations above), no need for additional measures beyond the current ones was identified in the 2025 financial year.
d) Control and reporting
The risk assessment is updated at least once a year by the Risk Control function in collaboration with the above-mentioned first-line-of-defence expert committee.
In its quarterly internal risk report, the Risk Control function reports on the risk situation, compliance with risk tolerance and compliance with limits in all risk categories to the Executive Board, the Risk and Strategy Committee of the Board of Directors and the Board of Directors. An analysis of the identified climate-related financial risks is added to the internal risk report at least once a year and submitted to the Executive Board and the Risk and Strategy Committee of the Board of Directors. Further details on reporting can be found in the ‘Managing sustainability’ section.
Further developments
FINMA data collection 2025
LUKB falls within FINMA supervisory Category 3. In 2025, FINMA conducted another survey on climate-related financial risks for institutions in Categories 1 to 3. This included a comprehensive data collection as at 31 December 2024 (quantitative part) and a supplementary questionnaire (qualitative part). The survey served as the basis for FINMA's report on climate risks, which was published in the FINMA Risk Monitor 20251) in November 2025.
FINMA Circular 2026/01 ‘Nature-related financial risks’
In December 2024, FINMA published Circular 2026/01 ‘Nature-related financial risks’1). It specifies the requirements for risk management, internal documentation, and the internal control system with regard to climate- and other nature-related financial risks. As a FINMA Category 3 institution, LUKB is currently implementing these requirements.
Climate strategy / climate transition plan
The Federal Council's Climate Reporting Ordinance, based on Article 964a et seq. of the CO (section on non-financial reporting), requires the preparation and publication of a climate roadmap (known as the ‘transition plan) that is comparable to the Swiss climate targets. It is designed to set the targets and measures with which the reporting company contributes to climate protection.
LUKB's climate transition plan is an integral part of its sustainability strategy and is in line with its overall strategy. It includes specific and time-bound targets as well as measures for the transition to the net-zero target by 2050 in accordance with the requirements of the Climate and Innovation Act (CIA) and the climate strategy of the Canton of Lucerne.
The transition plan was approved by the LUKB Board of Directors in 2024. The Executive Board is responsible for its implementation. The Board of Directors' Risk and Strategy Committee reviews and updates the transition plan at least once a year, most recently in the fourth quarter of 2025 as part of internal sustainability reporting. The climate transition plan is published annually in the Sustainability Report and appeared for the first time in 2024.
Defining and implementing the transition plan comes with risks and uncertainties. Progress towards reaching these targets depends on various factors, which are partly outside the sphere of influence of LUKB. A key prerequisite here is the decarbonisation of the economy over the coming years. LUKB is reliant on the necessary political framework conditions being put in place and further significant progress being made in the next few years with processes and technologies that prevent and remove emissions.
The uncertainties include macroeconomic trends, such as the effects of the economy and interest rates on the financial situation and thus on the affordability of decarbonisation measures by property owners and companies. Changes in climate policy or in laws and regulations may require adjustments to the transition plan. Another uncertainty relates to the greenhouse gas balance sheet on which the transition plan is based. It is currently still largely based on assumptions (see the explanations provided above). LUKB aims to create a better data basis by continuously improving data quality.
Targets
LUKB has set itself the following greenhouse gas targets:
Net-zero target 2050 in line with the Climate Strategy of the Federal Government and Canton Lucerne as well as the Climate and Innovation Act.
Interim targets
Scope | Area | Measurement | Base year | Base value | Interim targets | |||||
1 and 2 | Direct and indirect energy-related emissions | Absolute GHG emissions | 2014 | 991 tCO2e | Net-zero target by 2030: reduce greenhouse gases by around 80 % compared to 2014 levels to around 200 tCO2e by 2030; offset remaining greenhouse gas emissions from 2030 at the latest | |||||
1 and 2 | Direct and indirect energy-related emissions | Share of purchased electricity from renewable energy sources | 2023 | 100 % | 100 % share of purchased electricity from renewable energy sources over the years 2025 to 2030 | |||||
3 | Mortgages | Scope 1 and 2 CO2 emissions per m2 energy reference area (ERA) | 2023 | 30.3 kgCO2e/m2 ERA | At least –40 % compared to 2023 by 2030 (at most 18.2 kgCO2e/m2 ERA in 2030) | |||||
3 | Commercial real estate mortgages | Scope 1 and 2 CO2 emissions per m2 energy reference area (ERA) | 2023 | 27.0 kgCO2e/m2 ERA | At least –40 % compared to 2023 by 2030 (at most 16.3 kgCO2e/m2 ERA in 2030) |
The 2030 net-zero target for Scope 1 and Scope 2 emissions also meets the requirements of the Canton of Lucerne (majority shareholder of LUKB) in the 2025 Ownership Strategy (cantonal expectation: net-zero by 2040 for Scope 1).
For the time being, LUKB refrains from publishing explicit quantitative interim targets for Scope 3 emissions of the business loan portfolio, as the majority of emissions can, due to a lack of more precise data, currently be calculated only by using sector-based assumptions. At present, relatively few companies still publish data on their greenhouse gas emissions. LUKB also has a relatively small share of business loans in emission-intensive sectors (see the ‘Scope 3 greenhouse gas emissions – financed emissions’ section). LUKB grants loans only to companies that have their registered office in Switzerland and are subject to the binding sector-specific indicative targets for greenhouse gas reduction by 2040 and the net-zero target for 2050 in accordance with the Climate and Innovation Act (Art. 4 and 5 CIA) (indicative targets: Buildings sector: –82 % by 2040, –100 % by 2050; transport sector: –57 % by 2040, –100 % by 2050; industry sector: –50 % by 2040, –90 % by 2050). LUKB is therefore guided by these indicative targets.
Action areas and measures
LUKB has defined the following six action areas and derived specific measures from these:
Scope | Action area | Measures | ||||||
1 and 2 | 1 | Replace heating in own properties with fossil-free alternatives | 1.1 | Convert heating systems in own properties to fossil-free operation (if possible given planning regulations) | ||||
1.2 | Those buildings that are not wholly owned by LUKB will be assessed to determine whether heating systems might be run on renewable energies by 2025 | |||||||
1 and 2 | 2 | Make energy savings and expand renewable energies | 2.1 | Energy savings | ||||
2.1.1 | Reduce energy consumption both at company level and per employee | |||||||
2.1.2 | Implement universal target agreement with the act cleantech agency and ewl energy provider to optimise energy consumption at head office (energy efficiency measures) | |||||||
2.2 | Expand renewable energies | |||||||
2.2.1 | Use the power generation potential of own buildings and facilities | |||||||
2.2.2 | As far as possible, vehicle fleet to be electric by 2030 | |||||||
3 | 3 | Climate-friendly procurement, including a reduction in paper, envelope and water consumption, and waste volumes | See ‘Other topics’/'Procurement and waste disposal' section | |||||
3 | 4 | Climate-friendly mobility | 4.1 | Climate-friendly mobility options for business travel | ||||
4.2 | Climate-friendly mobility options for commuting | |||||||
3 | 5 | Investment and lending policy, as well as advisory services and products, that factor in environmental criteria | 5.1 | See ‘Lending business’ section | ||||
5.2 | See ‘Investment business’ section | |||||||
1 to 3 | 6 | Training and awareness-raising for employees | See ‘Employer responsibility and attractiveness’, ‘Sustainability training’ section | |||||
The following pages describe the status of the individual action areas and measures.
Action Area 1: Replace heating in own properties with fossil-free alternatives
Customer proximity is a key element of the LUKB business model. For this reason, to serve its clients in person LUKB operates a close network of branches at 22 locations in the Canton of Lucerne and one in Zurich, with two sales offices in French- and Italian-speaking Switzerland (Lausanne and Lugano, respectively). In addition, the Bank offers a major share of its services 24/7 via electronic channels such as the lukb.ch website and its app for smartphones.
The following map shows LUKB properties as at 31 December 2025, distinguished by ownership structure:
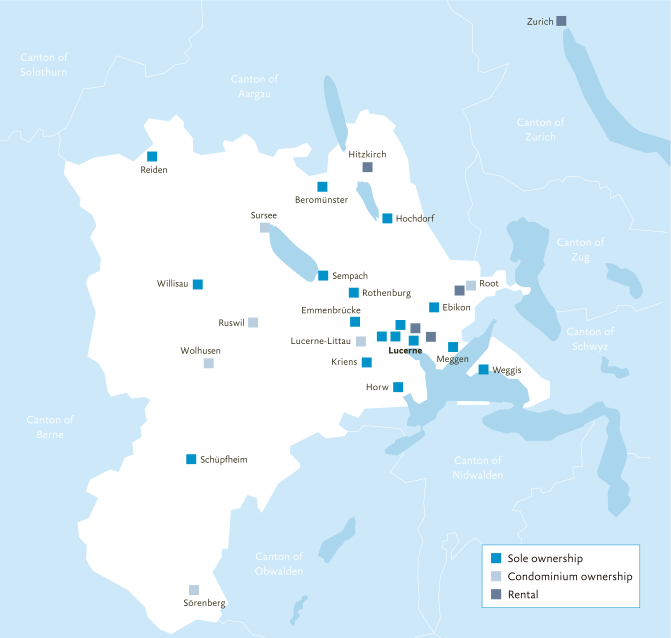
LUKB wholly owns 17 buildings and partially owns six as condominiums. The remaining branch offices are in leased premises. In most cases, LUKB properties are either classic bank buildings or mixed-use real estate.
In addition to its automated banks at Grendelstrasse (Lucerne), at the Schönbühl Centre (Lucerne), the Emmen Centre (Emmenbrücke), the Mall of Switzerland (Ebikon), in Sursee Oberstadt and in the Surseepark (Sursee), LUKB has a dense network of ATMs throughout the canton. LUKB rents the space it requires for these ATM locations.
Action Area 1 of this part of the report does not cover any rented space. The following describes the measures taken by LUKB for each sphere of action.
Measure 1.1: Conversion of heating systems in own properties to fossil-free operation by 2025 (if possible given planning regulations)
For historical reasons, most LUKB properties are heated with fossil fuels. LUKB has been working since 2014 towards running its own properties fossil-free by 2025.
Status of wholly owned LUKB properties as at 31 December 2025:
Location | Building status | LUKB target1) | Work progress | |||
Beromünster, Fläcke 15 | Heat pump | Heat pump | Implemented | |||
Ebikon, Zentralstrasse 14 | District heating (waste heat) | District heating (waste heat) | Implemented | |||
Emmenbrücke, Gerliswilstrasse 4 | Fossil fuel | District heating (waste heat) | Connection to district heating is planned for the ‘METROPOOL’ newbuild project. The construction permit for the new building is not yet final | |||
Hochdorf, Hauptstrasse 30 | District heating (wood) | District heating (wood) | Implemented | |||
Horw, Gemeindehausplatz 2/3 | District heating (wood) | District heating (lake water) | Provider has started work on changing the energy source. Due to delays on the part of the energy supplier, implementation is now planned for the 2026/2027 heating period. | |||
Kriens, Schachenstrasse 6 | Heat pump | Heat pump | Implemented | |||
Lucerne, Grendelstrasse 5 | Fossil fuel | Exploratory stage | None of the alternatives discussed with the energy supplier can be implemented. | |||
Lucerne, Hirschmattstrasse 12/14 | Fossil fuel | District heating (lake water) | The plan was to connect to district heating in autumn 2024. Due to delays on the part of the energy supplier, implementation is now planned for the 2026/2027 heating period. | |||
Lucerne, Pilatusstrasse 12/14 | Fossil fuel | District heating (lake water) | The plan was to connect to district heating in autumn 2024. Due to delays on the part of the energy supplier, implementation is now planned for the 2026/2027 heating period. | |||
Lucerne, Theaterstrasse 5 | Fossil fuel | District heating (lake water) | The plan was to connect to district heating in autumn 2024. Due to delays on the part of the energy supplier, implementation is now planned for the 2026/2027 heating period. | |||
Meggen, Hauptstrasse 52 | Fossil fuel | Heat pump | Discussions with the owners of the neighbouring plots, which operate a single heating system with LUKB, led to the decision to replace the existing system with a heat pump. The hot water supply has already been implemented and the date for the heating changeover has not been set yet. | |||
Reiden, Hauptstrasse 48 | Fossil fuel | District heating (wood) | According to the energy supplier, the property will be connected to district heating in summer 2026. | |||
Rothenburg, Flecken 23 | Heat pump | Heat pump | Implemented | |||
Schüpfheim, Hauptstrasse 31 | Heat pump | Heat pump | Implemented | |||
Sempach, Stadtstrasse 2 | District heating (wood) | District heating (wood) | Implemented | |||
Weggis, Seestrasse 6 | District heating (lake water) | District heating (lake water) | Implemented | |||
Willisau, Vorstadt 11 | Heat pump | Heat pump | Implemented |
1)The ‘LUKB target’ column shows the heating system targeted by the end of 2025. The actual timing of implementation is set for each building individually.
Among other things, there are plans for 2026/27 for the existing energy supplier to switch from fossil fuel-based energy to lake water for the head office and two other locations in the city of Lucerne. LUKB also intends to realise the METROPOOL project at Seetalplatz in Emmenbrücke over the next few years (building permit not yet legally binding as of 31 December 2025). LUKB will be able to make further greenhouse gas savings when this Minergie®-certified building has been completed.
Measure 1.2: Buildings not wholly owned by LUKB will be assessed to determine whether heating systems might be run on renewable energies by 2025
LUKB actively fulfils its responsibility as condominium owner and is a vocal advocate of replacing fossil energies with renewables.
Status of properties in condominium ownership as at 31 December 2025:
Location | Building status | LUKB target1) | Work progress | |||
Lucerne (Littau), Fanghöfli 6 | District heating (waste heat) | District heating (waste heat) | Implemented | |||
Root, Bahnhofstrasse 16 | District heating (waste heat) | District heating (waste heat) | Implemented | |||
Ruswil, Hellbühlerstrasse 10 | Fossil fuel | District heating (wood) | New district heating centre in preparation, implementation date tbd | |||
Sörenberg, Rothorn-Center 3 | Heat pump | Heat pump | Implemented | |||
Sursee, Bahnhofstrasse 33, Christoph-Schnyder-Strasse 2/2a (Dreiklang) | District heating (waste heat, biogas) | District heating (waste heat, biogas) | Implemented | |||
Wolhusen, Menznauerstrasse 11 | District heating (wood) | District heating (wood) | Implemented |
1)The ‘LUKB target’ column shows the heating system targeted by the end of 2025.
LUKB remains with the above targets for buildings it owns fully or as condominiums over the next few years and is pursuing their implementation consistently. An alternative version is being developed for the Grendelstrasse 5 location in Lucerne.
Action Area 2: Make energy savings and expand renewable energies
At present, producing and consuming electrical energy contributes to the pollution of the environment and climate in Switzerland. This is primarily due to the use of fossil fuels such as coal, oil or gas to generate power. The exploration of renewable sources of energy may also conflict with the environment, natural world and countryside conservation, however. With this in mind, LUKB has defined a series of measures for a sustainable energy policy.
Action Area 2.1: Energy savings
Measure 2.1.1: Reduce energy consumption both at company level and per employee
LUKB has set itself the goal of steadily reducing its energy consumption. This overall target relates to both power use in general and building energy (electricity, gas/oil, other fuels) in particular. The power required by LUKB's buildings is heavily weather-dependent.
The trend in LUKB's total energy consumption is as follows:
Energy consumption in business operations1) | Unit | 2023 | 2024 | 2025 | ||||
Total energy consumption | GJ2) | 22,150 | 22,047 | 21,493 | ||||
of which renewable | GJ | 13,936 | 14,084 | 15,234 | ||||
Share of renewable energy | % | 63 % | 64 % | 71 % | ||||
Total electricity consumption | GJ | 11,779 | 12,292 | 12,013 | ||||
of which renewable | GJ | 11,779 | 12,292 | 12,013 | ||||
Share of renewable | % | 100 % | 100 % | 100 % | ||||
Electricity purchased | GJ | 11,779 | 12,292 | 12,013 | ||||
of which renewable | GJ | 11,779 | 12,292 | 12,013 | ||||
Share of renewable | % | 100 % | 100 % | 100 % | ||||
Electricity produced in-house3) | GJ | 0 | 0 | 0 | ||||
of which renewable | GJ | 0 | 0 | 0 | ||||
Share of renewable | % | n. a. | n. a. | n. a. | ||||
Heating energy consumption4) | GJ | 2,096 | 1,872 | 1,929 | ||||
of which renewable | GJ | 2,061 | 1,601 | 1,792 | ||||
Share of renewable | % | 98 % | 86 % | 93 % | ||||
Cooling energy consumption | GJ | 0 | 191 | 1,429 | ||||
of which renewable | GJ | 0 | 191 | 1,429 | ||||
Share of renewable | % | n. a. | 100 % | 100 % | ||||
Steam consumption | GJ | 0 | 0 | 0 | ||||
of which renewable | GJ | 0 | 0 | 0 | ||||
Share of renewable | % | n. a. | n. a. | n. a. | ||||
Combustibles and fuels | GJ | 8,274 | 7,692 | 6,122 | ||||
of which renewable | GJ | 96 | 0 | 0 | ||||
Share of renewable | % | 1.2 % | 0.0 % | 0.0 % | ||||
Natural gas | GJ | 6,574 | 5,866 | 4,677 | ||||
Heating oil | GJ | 1,214 | 1,431 | 1,066 | ||||
Petrol | GJ | 212 | 237 | 213 | ||||
Diesel | GJ | 179 | 159 | 165 | ||||
Wood | GJ | 96 | 0 | 0 | ||||
Number of employees (annual average, full-time equivalents) | FTEs5) | 1,106.40 | 1,160.00 | 1,191.70 | ||||
Total internal energy consumption per employee | GJ/FTE | 20.0 | 19.0 | 18.0 | ||||
Heating degree days (HDDs) Lucerne | HDDs | 2,840 | 2,797 | 2,893 |
1)Source: Consumption figures from energy suppliers in kWh
Basis for disclosure: Global Reporting Initiative (GRI) standards
The figures cover the company's own energy consumption at all locations within the Group. These figures do not include energy consumption in externally leased space (see separate table).
2)GJ: gigajoules
3)The electricity produced by solar panels is not consumed by the company itself, but sold. It is therefore not recorded separately within electricity consumption.
4)Correction of thermal energy consumption in 2024 due to effective billing for a property by +193 GJ
5)FTEs: full-time equivalents
The table below also shows energy consumption in externally leased space:
Energy consumption – leased space1) | Unit | 2023 | 2024 | 2025 | ||||
Total energy consumption | GJ2) | 8,431 | 5,530 | 4,222 | ||||
of which renewable | GJ | 1,129 | 1,962 | 1,208 | ||||
Share of renewable energy | % | 13 % | 35 % | 29 % | ||||
Total electricity consumption | GJ | n. a. | n. a. | n. a. | ||||
of which renewable | GJ | n. a. | n. a. | n. a. | ||||
Share of renewable | % | n. a. | n. a. | n. a. | ||||
Electricity purchased | GJ | n. a. | n. a. | n. a. | ||||
of which renewable | GJ | n. a. | n. a. | n. a. | ||||
Share of renewable | % | n. a. | n. a. | n. a. | ||||
Electricity produced in-house | GJ | n. a. | n. a. | n. a. | ||||
of which renewable | GJ | n. a. | n. a. | n. a. | ||||
Share of renewable | % | n. a. | n. a. | n. a. | ||||
Heating energy consumption | GJ | 1,266 | 2,427 | 1,503 | ||||
of which renewable | GJ | 1,034 | 1,702 | 1,208 | ||||
Share of renewable | % | 82 % | 70 % | 80 % | ||||
Cooling energy consumption | GJ | 0 | 259 | 0 | ||||
of which renewable | GJ | 0 | 259 | 0 | ||||
Share of renewable | % | n. a. | 100 % | n. a. | ||||
Steam consumption | GJ | 0 | 0 | 0 | ||||
of which renewable | GJ | 0 | 0 | 0 | ||||
Share of renewable | % | n. a. | n. a. | n. a. | ||||
Combustibles and fuels | GJ | 7,165 | 2,843 | 2,718 | ||||
of which renewable | GJ | 96 | 0 | 0 | ||||
Share of renewable | % | 1.3 % | 0.0 % | 0.0 % | ||||
Natural gas | GJ | 6,465 | 2,485 | 2,515 | ||||
Heating oil | GJ | 700 | 358 | 203 | ||||
Petrol | GJ | 0 | 0 | 0 | ||||
Diesel | GJ | 0 | 0 | 0 | ||||
Wood | GJ | 0 | 0 | 0 | ||||
Heating degree days (HDDs) Lucerne | HDDs | 2,840 | 2,797 | 2,893 |
1)Source: Consumption figures from energy suppliers in kWh
Basis for disclosure: Global Reporting Initiative (GRI) standards
The electricity consumption of leased space is not recorded, as tenants are responsible for purchasing their own electricity.
2)GJ: gigajoules
Since 2014, LUKB has gradually raised its strategic targets for energy consumption per employee, aiming for 5,500 kWh equivalents per employee from the end of 2020 to 2025 (2015: 9,517 kWh / for 2020: 7,315 kWh). This target figure refers to electricity, heating and cooling energy consumption as well as to combustibles and fuels.
LUKB has reached its consumption target of 5,500 kWh equivalents per employee. Energy consumption per employee was 5,379 kWh in 2024 and 5,129 kWh in 2025. The further decline is primarily attributable to the reduction in the consumption of fossil fuels.
The following graph shows the trend in energy consumption per LUKB employee since 2014:
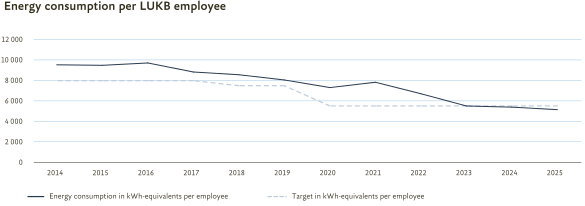
The drivers of this sharp drop in energy consumption are:
- Renovate own properties (Minergie®-certified new builds and remodelling of numerous branch offices) as needed
- Replace building systems and other technologies regularly
Measure 2.1.2: Implement the provisions of the universal target agreement with the ‘act’ and ‘ewl’ utilities to optimise energy consumption at the head office (energy efficiency measures)
At LUKB, only the head office in Lucerne is a major buyer of electricity. In accordance with the statutory requirements, LUKB aims to reduce power consumption at its head office by at least 10 % per year. The federal government has mandated the ‘act’ utility (cleantech agency Switzerland) to enforce climate and energy legislation. The ‘act’ utility advises organisations and other entities about cantonal enforcement instruments.
By entering into the universal target agreement for the head office in 2018, LUKB committed to achieving financially profitable energy goals within ten years. Following a close analysis, the energy specialist of the ‘ewl’ utility proposed efficiency measures tailored specifically to LUKB. Beginning in 2020, progress towards the targets has been measured using a weighted overall energy efficiency indicator.
The ‘act’ and ‘ewl’ utilities report annually on their monitoring activities. The currently available report is for 2024. It states that LUKB is on course to meet its overall energy efficiency targets. The value for 2024 was 116 %, with an annual target of 121 %.
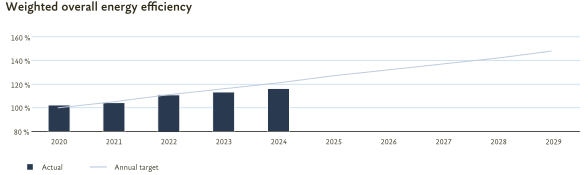
Action Area 2.2: Expand renewable energies
Measure 2.2.1: Use the power generation potential of own buildings and facilities
LUKB has a great interest in making its buildings fossil-free by harnessing renewable energies. In its assessment, solar and wind power are viable ways of meeting its power needs. As stated in the introduction to Action Area 2, the construction and operation of renewable energy sources may cause conflict. LUKB planning must therefore incorporate the widest variety of conditions, such as building zone regulations, the requirements of the Inventory of Swiss Heritage Sites (ISOS), and restrictions on changes to historical buildings and monuments. Furthermore, condominium ownership limits LUKB's options significantly more than sole ownership.
Status of wholly owned properties as at 31 December 2025:
Location | Building status | Work progress | ||
Beromünster, Fläcke 15 | No PV | Result of review by ISOS: not feasible (listed building) | ||
Ebikon, Zentralstrasse 14 | PV | Implemented | ||
Emmenbrücke, Gerliswilstrasse 4 | No PV | PV already planned for ‘METROPOOL’ newbuild project | ||
Hochdorf, Hauptstrasse 30 | PV | Implemented | ||
Horw, Gemeindehausplatz 2/3 | PV | Implemented | ||
Kriens, Schachenstrasse 6 | PV | Implemented | ||
Lucerne, Grendelstrasse 5 | No PV | Result of review by ISOS: not approved | ||
Lucerne, Hirschmattstrasse 12/14 | No PV | Not implemented due to cost-benefit considerations | ||
Lucerne, Pilatusstrasse 12/14 | PV | Solar panels on roof of building | ||
Lucerne, Theaterstrasse 5 | No PV | Will be implemented when building is renovated, date to be decided | ||
Meggen, Hauptstrasse 52 | PV | Implemented | ||
Reiden, Hauptstrasse 48 | PV | Implemented | ||
Rothenburg, Flecken 23 | No PV | Result of review by ISOS: not feasible (listed building) | ||
Schüpfheim, Hauptstrasse 31 | PV | Implemented | ||
Sempach, Stadtstrasse 2 | No PV | Result of review by ISOS: not feasible (listed building) | ||
Weggis, Seestrasse 6 | No PV | Not implemented due to cost-benefit considerations | ||
Willisau, Vorstadt 11 | No PV | In planning, implementation scheduled for 2026 |
Status of properties as condominiums as at 31 December 2025:
Location | Building status | Work progress | ||
Lucerne (Littau), Fanghöfli 6 | No PV | LUKB has no own space for PV, must be examined with the condominium owner association (date tbd) | ||
Root, Bahnhofstrasse 16 | No PV | LUKB has no own space for PV, must be examined with the condominium owner association (date tbd) | ||
Ruswil, Hellbühlerstrasse 10 | No PV | LUKB has no own space for PV, must be examined with the condominium owner association (date tbd) | ||
Sörenberg, Rothorn-Center 3 | No PV | LUKB has no own space for PV, must be examined with the condominium owner association (date tbd) | ||
Sursee, Bahnhofstrasse 33, Christoph-Schnyder-Strasse 2/2a (Dreiklang) | PV | Implemented | ||
Wolhusen, Menznauerstrasse 11 | No PV | LUKB has no own space for PV, must be examined with the condominium owner association (date tbd) |
Measure 2.2.2: As far as possible, vehicle fleet should be electric by 2030
LUKB has its own fleet of vehicles. In recent years, LUKB has switched a range of services for its local branch offices, including ATMs, into in-house operations again. It therefore normally relies on its fleet of electric vehicles to provide these services. Old vehicles will generally be replaced with ones that have an alternative power source.
Status as at 31 December 2025:
- The LUKB fleet has 12 vehicles.
- Half of these are fully electric.
- Three vehicles have a hybrid drive system.
Action Area 3: Climate-friendly procurement, including lower paper, envelope and water consumption and waste volumes
As a service provider, LUKB focuses mainly on providing offerings to its clients. The procurement of tangible assets and goods is only secondary. LUKB's regular purchases comprise primarily paper and office supplies. After energy consumption, LUKB's use of paper is of second-greatest relevance environmentally. LUKB is taking a range of measures to guide employee and client behaviours to steadily reduce the volume of paper the Bank consumes.
For further information, please refer to ‘Procurement and waste disposal’ in the ‘Other topics’ section.
Action Area 4: Climate-friendly mobility
Measure 4.1: Climate-friendly mobility for business travel
LUKB does most of its business in the Lucerne economic region. It therefore has little need for long-distance travel, except for couriers and business trips mainly within central Switzerland.
Air travel plays a negligible role at LUKB: In 2025, air travel came to approx. 22,400 kilometres (previous year: approx. 11,000). The distances travelled mainly involved a business trip to East Asia. As in the previous year, the CO2 emissions of the reported kilometres travelled were fully compensated.
Status as at 31 December 2025:
- The internal expense policy follows the principle of keeping expenses for business-related travel as low as possible and within budget.
- LUKB employees are already able to order paperless single and multiple-trip tickets for travel on public transport digitally via the SBB Mobile portal. Costs are directly allocated to the individual divisions.
- Business travel by car is recorded centrally. LUKB has taken measures (such as the promotion of video conferences) to reduce the number of trips and kilometres covered.
- Any air travel must be approved centrally by LUKB Human Resources. As a rule, CO2 emissions from approved flights will be fully offset.
- Mobility sharing schemes are available at a number of locations, such as head office in Lucerne or at Dreiklang in Sursee, and include nextbike cycle hire, and car-sharing from Mobility and Share Birrer in Sursee.
LUKB also creates incentives for customer appointments to be as climate-friendly as possible. Bank clients want an individual service, including personal meetings with an advisor. LUKB has a range of measures in place to ensure that it can accommodate specific client needs.
Status as at 31 December 2025:
- As part of its digitalisation strategy, LUKB now offers its clients a videoconferencing option as standard for meetings.
- LUKB is continually expanding its online offers, including mobile services. The aim is for clients to be able to do their day-to-day banking independently 24/7, regardless of their location, and have their often more complex needs discussed in face-to-face meetings.
Measure 4.2: Climate-friendly mobility options for commuting
In 2024, LUKB conducted a mobility survey among all employees. The survey results formed the basis for calculating the GHG emissions from commuting (see the table above on Scope 3 emissions in the ‘Scope 3 greenhouse gas emissions’) section and for further internal analyses. LUKB will continue to conduct such surveys regularly, the next time in 2026, and will decide on further measures if necessary.
Status as at 31 December 2025:
- LUKB encourages its employees to use public transport to commute to work. It therefore contributes towards annual season tickets each year. As an employer, it paid 138,600 Swiss francs to promote public transport use in 2025 (previous year: approx. 124,000 Swiss francs). See table below.
- Employee parking is reviewed periodically with respect to local facilities. There is a limited number of parking spaces in the city of Lucerne and the surrounding area. The availability of parking spaces is one way in which LUKB can directly influence its employees' mobility.
- Progressive rules apply to working from home and remote working.
- Employees can use the internal staff restaurant or eat at subsidised local venues. This reduces the need for mobility at mealtimes.
- LUKB supports its employees with very attractive offers from Reka. The maximum amount depends on the person's marital status and/or on the number of children.
- Within the limits of the available capacity, LUKB provides its employees with free cycle and motorcycle parking spaces that are covered wherever possible.
- With more than 100 employees, LUKB took part in the ‘bike to work’ programme and the ‘Luzernmobil Challenge 2025’ in 2025.
Spending on encouraging public transport usage | Unit | 2023 | 2024 | 2025 | ||||
Promotion of public transport to commute to work | ||||||||
Number of staff who received a public transport subsidy | Number | 428 | 423 | 504 | ||||
Public transport subsidy for staff | CHF | 116,100 | 124,000 | 138,600 | ||||
Environmental benefit of using public transport – business travel and commuting1) | ||||||||
CO2 savings (in tonnes of CO2 equivalents) | tCO2e | 421 | 490 | n. a. | ||||
Energy savings (in gigajoules) | GJ | 8,177 | 9,512 | n. a. | ||||
Environmental benefit of using public transport – business travel only2) | ||||||||
CO2 savings (in tonnes of CO2 equivalents) | tCO2e | 19 | 24 | 30 |
1)Source: SBB emissions reports 2023 and 2024. The two figures for 2025 are no longer available in the SBB emissions report 2025. Reason: Change in the report content by the SBB.
1)Source: SBB emissions reports 2023 to 2025
Action Area 5: Investment and lending policies, as well as advisory services and products, that factor in environmental criteria
As a key player in the lending and investment business, including property finance, LUKB is aware of the significant influence it has on climate protection in its economic region. It therefore aims to address the interests of the environment as well as of its stakeholders. LUKB reports on its principles, objectives and measures in the ‘Investment business’ and ‘Lending business’ sections.
LUKB also uses sustainability principles when managing its financial investments. Further information can be found under ‘Sustainability principles for managing financial investments’ in the ‘Other topics’ section.
Action Area 6: Training and awareness-raising for employees
Please refer to ‘Sustainability training’ in the ‘Employer responsibility and attractiveness’ section for more details.